



Evaluations and dashboards for SAP
From real-time KPIs to customized reports—Flexus dashboards provide you with the information you need to make decisions that lead to greater efficiency, transparency, and control.


Flexus AG
Bring order to the number madness
Dashboards visualize relevant information and provide clarity on your operational and strategic metrics.
They offer a quick overview of areas such as logistics, production, or transportation, and help you manage, analyze, and continuously improve processes in a targeted manner.
So you have everything in view
Analyses and regular checks are important tools for ensuring the long-term success of a system, because only through continuous transparency can you make well-informed decisions.
Flexus’s various dashboards and analytics apps allow you to view the current status of your processes at any time, enabling you to identify both opportunities for optimization and potential risks or critical scenarios early on.
In this way, you can intervene in processes in a timely manner and make your internal structures and processes more efficient step by step.
This not only saves you unnecessary extra effort, but above all valuable time and ultimately costs – while simultaneously creating a stable basis for sustainable process improvements.
Digression: What are SAP dashboards?
Dashboards are generally used to clearly visualize information, allowing you to quickly gain a targeted overview of relevant areas such as logistics or production.
Many companies define both operational and strategic metrics, which are then used for process control and optimization because they create transparency and facilitate decision-making.
These key metrics are then correlated with one another and aggregated in dashboards along with other analyses, allowing you to identify correlations more quickly and better assess trends. Such visualizations are particularly helpful for managing specific areas such as goods receipt or goods issue, as deviations become immediately apparent and you can respond in a timely manner when values exceed or fall below defined thresholds.
Dashboards have also become indispensable when it comes to identifying optimization opportunities and uncovering weaknesses, as they combine meaningful metrics with clear visual elements, making your entire logistics processes significantly more transparent.
Taking it a step further, stored metrics can also be analyzed historically, enabling predictions about future developments —a key component of modern predictive analytics approaches.
Dashboards for SAP Fiori – an overview
Different dashboards are available for SAP Fiori. Gain insights into your SAP EWM and SAP WM processes! We are also happy to develop your own apps based on your individual wishes and requirements within logistics. Get an insight into the world of dashboards here:
SAP EWM Dashboard
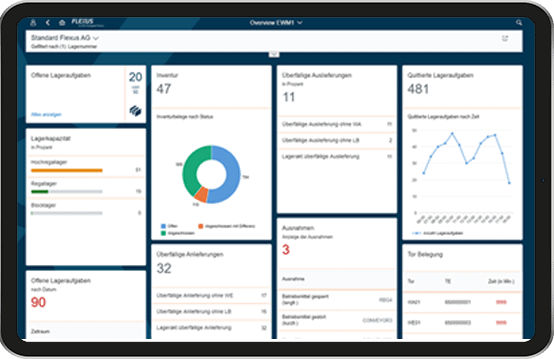
We have defined key metrics and visualized them in clearly structured dashboards—not only for the further development and optimization of our own products, but also for your custom projects.
In SAP EWM, individual data can be displayed as a table via the Warehouse Management Monitor, but this view often takes significantly more time because you have to click through a lot of detailed information. With a dashboard, on the other hand, you can see all relevant key metrics at a glance, allowing you to react more quickly and analyze data more easily.
- Number of open storage tasks
- Status of the inventory documents
- Number of overdue deliveries
- Number of overdue shipments
- Current gate occupancy
- Overview of confirmed storage tasks
- Storage capacity
Depending on the key figure, different diagrams (simple list, bar chart, line chart, column chart) are used for your visualisation to ensure clarity and simplicity.
We are also happy to incorporate your individual key figures and evaluations into the finished dashboards. These are developed and integrated together with the specialist department and our SAP experts.
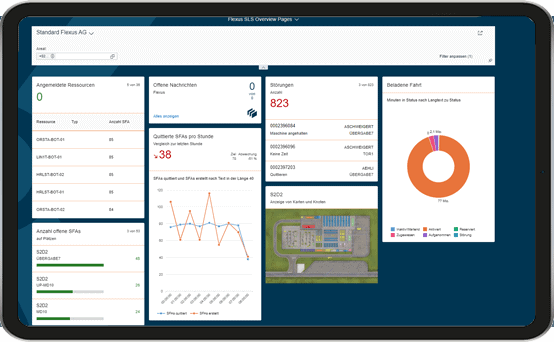
Dashboard for the transport control system
Our standard BI dashboard for the FlexGuide transport control system uses the data obtained to visualize, for example, evaluations of journey times, the transport order load on different days or disruptions. Details on the capacity utilization of forklifts, tugger trains or AGVs can be easily visualized. Key figures such as utilisation, distance travelled, fault messages can be viewed at a glance in the dashboard.
Your logistics evaluations with BI tools
Our business intelligence software enables the direct collection, analysis, transformation, and reporting of SAP data.
The applications access data from your SAP system—often from a data warehouse or data mart—and prepare it for reporting, monitoring, and decision-making processes.
Flexus provides standardized BI interfaces that allow you to process your SAP data quickly and in a structured manner. These integrations support modern BI tools, speed up your analyses, and create a reliable foundation for data-driven decisions.
Flexus’ BI dashboards:
- Visualize results clearly and comprehensibly and monitor target and actual metrics
- offer a fast, high-performance interface with intuitive drag-and-drop controls
- compare your data through a thorough, systematic analysis
- provide a high level of interactivity for real-time analysis
- can be retrieved directly from SAP via OData or Excel export
- connect not only SAP but also additional systems—such as machine malfunctions or third-party software


COntact