Warehouse management with SAP EWM – optimized control of industrial trucks
With EWM, SAP offers a powerful Warehouse Management solution that can be used to map complex flows of goods and logistics processes in the standard. Regardless of whether small parts with a batch size of 1 or large-volume plants are involved – the foundation is always a warehouse task that contains an order to move material from a source to a sink (drop-off point). This applies to all material flows: storage, removals, and transfers, as well as production supply and disposal, to name only the most important ones.
Depending on the type of material, production requirements or temporal priorities, all kinds of industrial trucks can be used: from manual to electric lift trucks, forklifts, tugger trains or Automated Guided Vehicles (AGVs). For the manually operated vehicles, SAP EWM offers with Resource Management and RF UI two tools for mobile assignment and confirmation of warehouse tasks. But the more complex the rules for the assignment and processing sequence get, the more SAP EWM reaches its limits. This is even more noticeable if tugger trains are used, which are characterized by the simultaneous processing of a large number of warehouse tasks and a route that is more or less fixed depending on circumstances.
Overcome limitations with fully dynamic tugger train control for SAP EWM

This is where the FlexGuide with the tugger train add-on and the dynamic tugger train control steps in. First of all, all EWM warehouse tasks that should be executed by the tugger train are identified. For these warehouse tasks, a so-called transport task is generated within the FlexGuide-TGS and collected in the task pool. It is also possible to set up a two-stage picking process in which trailers or carts are prepared by a warehouse employee and made available for pickup by the tugger train.
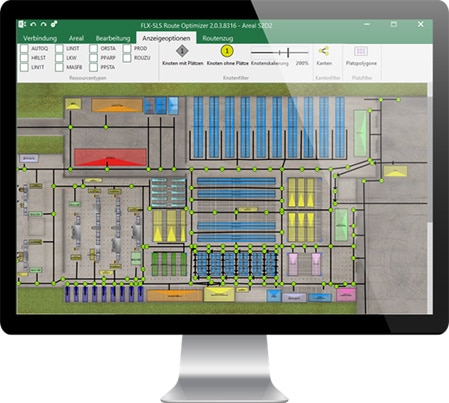
In an effort to streamline such maintenance and avoid having to use the layout- or process-oriented storage control of EWM, a web-based graphical tool for the maintenance of the plant topology is made available. It can be used to draw all EWM warehouse locations on the plant map and link them to paths. By assigning resource types to paths, a resource type change can occur automatically between the picker and the tugger train.
Master data for optimized tour planning – automated and dynamic
The system is also fed with additional master data: how many tugger trains are available, how many trailers can the tugger train pull, how many transport tasks of which HU type can be loaded, in combination with other HU types, onto a trailer, etc. With dynamic route determination, it is no longer required to define fixed routes with a fixed order of stations. An optimized, dynamically calculated route, based on the possible paths, one-way streets and turning areas, is in fact created for each individual tour.
Optimization and distribution of the task pool
Now this is exactly what makes the core of the system work during ongoing operation: the optimization and distribution of the task pool to the existing tugger trains. In doing so, the system continuously optimizes various factors: the number of tugger trains used should be kept to a minimum, the total distance covered by all tugger trains should be as short as possible, and all transport tasks should arrive at their destination on time. The prioritization of the individual factors can be changed at any time to meet the requirements. The underlying algorithms of the system use heuristics in order to be able to calculate the sheer infinite combination possibilities in a reasonable amount of time.
The result of the optimization is a tour schedule for a certain time horizon in the future. It is continuously adjusted if new transport tasks are added or tours have already been started. In a web interface, the tour schedule can be displayed graphically in a Gantt chart, and the status of a tour is highlighted in color to make disruptions or malfunctions visible at a glance. The tugger train driver can see on a tablet the next tour that he has to work on next according to the tour schedule. In a clear, split display, he can see which tasks he still has to pick up at which location and which tasks he has to move to which destination. The next action he has to perform within the optimized tour is always highlighted. With visual support of a 2D map, on which the entire tour and the next station are marked, he can process the tour as specified by the system. Once a transport task has arrived at its destination in production, he confirms the transport task on his tablet. This automatically leads to a confirmation of the linked EWM warehouse task in the background, which completes the circle.

Dashboards and KPIs for analysis and evaluation
Warehouse managers and key users have access to detailed evaluation options with KPIs that measure the performance of the system. For example, key indicators such as the percentage of on-time deliveries, the number of transport tasks per tour, and the workload of the tugger trains can be evaluated. These key indicators are also transferred back into the system for further improvement of the optimization parameters. .

Author – Christian Zerbes
Head of Transport Systems
In the course of his work at Flexus, he successfully implements projects in the field of Transport Systems. The projects range from the implementation of a simple forklift call system to the fully dynamic control of a wide variety of resources such as tugger trains, forklifts or automatic guided vehicles.

