KPIs and the benefit of KPIs
Digitalization of industrial processes, such as in logistics, generates large amounts of data. This data usually remains untapped, however, even though it can be used to gain insights into processes and uncover optimization potential. Unprocessed and unfiltered data is called raw data. It often contains interesting information for process monitoring. Yet they can neither be compared nor evaluated without additional processing. It is therefore particularly important to acquire condensed and comparable data from the accumulated raw data. This data is known as key performance indicators (KPIs).
These indicators enable end users of the system to understand and evaluate correlations and the behavior of the entire system after a short training period and with good documentation. Therefore, the expertise of a key user is no longer required if the raw data is prepared properly.
Series of articles on the exiting subject of indictors in logistics
In the coming weeks, we would like to offer you a detailed look into the world of KPIs and into our research project FML – MuCRoute with the TU Munich. For this purpose, we have prepared different articles on the topic of KPIs, each covering a different field of interest. You can look forward to getting answers to the following questions, among others:
- How are KPIs determined and how do you develop them?
- What techniques were applied for creation, determination, and visualization in the research project?
- Which platforms can present indicators?
- What do our customers say about KPIs?
- Which KPIs do we feel are important in the field of logistics?
Today, we start with general information on the subject of KPIs. What does this mean in technological terms and how are they used in logistics in particular?
KPIs in (intra-)logistics
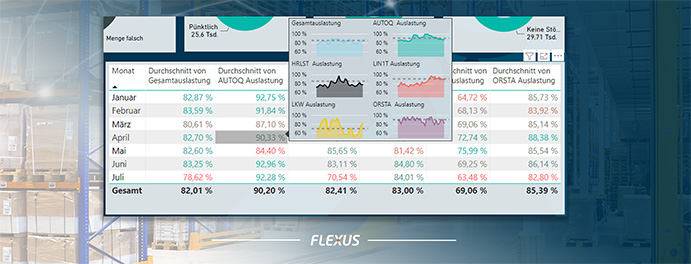
Alongside the indicators of SAP modules such as SAP WM or SAP EWM, the Flexus Transport Guidance System is also a source of more detailed raw data – in particular on transport movements.
The various resource types, in other words vehicle types such as forklifts, Automated Guided Vehicles (AGV) or tugger trains, generate interesting data for analyses. Moreover, the different operating resources can be analyzed in depth. . Based on the paths taken, the workload or the load distribution of the resources can be displayed and observed.
Additional empty runs within these paths are of particular interest. From these, it can be deduced which optimization potentials the warehouse layout harbors. One example would be that it is observed that materials only flow in one direction, meaning that the way back always carries an empty load. All in all, the resource workload can be calculated using paths, empty runs and utilization rates.

Furthermore, the Transport Guidance System can be analyzed at the level of transport movements. For this purpose, it is a good idea to use transport tasks, which document the transport of goods, as well as their change history as a data foundation. If a due date – a time at which the transported goods are required at the destination – is stored in transport tasks, it is usually required to adhere to this due date. Otherwise it could happen, in the worst case, that material and machines cannot continue production. As a consequence, one of the most important KPIs is the delivery reliability. It describes the percentage of tasks that have arrived at their destinations within the specified due date. However, not every task should be treated equally. For example, it is much more important to meet the due dates for raw materials that are needed in production than the due dates for empties, which are set to ensure that production does not get flooded with empties.

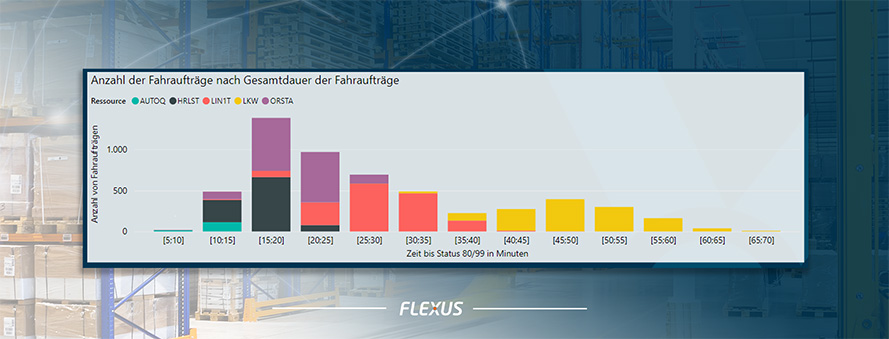
In order to measure the response time of logistics, the processing time of the tasks must be observed. This refers to the time that expires between the creation and completion of the task. Similarly, times such as the length of time it takes for a good to be made available until it is moved can be of importance for substeps and processes. This makes it possible to more effectively plan processes such as the lead time, which is required for the provision of goods, or the size of buffer locations. Additionally, it is possible to observe how many tasks were active at any given time via the transport task pool. As such, it can be monitored at what time peaks of workload occur to allow more work resources to be scheduled for future shifts that are very busy. As a result, peaks of workload can be mitigated to prevent complications.
If a process deviates from standard procedure, for example when manual confirmations are created or load carriers or destination locations are changed, this is an indicator of differences between the concept, the processes and their implementation. This can draw attention to irregularities that hold back overall productivity. Similarly, malfunction notifications related to tasks are a warning indicator. If, for example, the malfunction “transport damage” is always reported for a transport route, it can be checked whether the route bears any signs of damage or whether the goods are not sufficiently secured to be transported by a forklift.
Correct interpretation and use of indicators

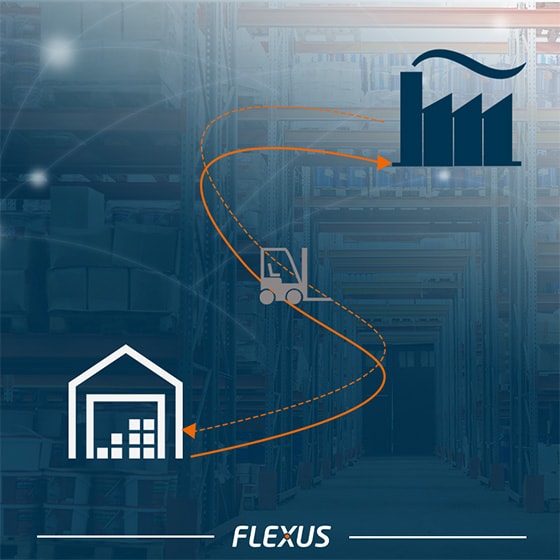
As mentioned earlier, KPIs should not be examined without context, otherwise the wrong conclusions will be drawn. The resource workload is a good example for this. If we consider the constellation that goods are always moved from Hall A to Hall B, but nothing is ever delivered from Hall B to Hall A, this inevitably results in empty runs on the way back. If there were no other halls and processes, around half of the distances covered would be empty runs and resource workload would at most reach a value of around 50 percent.
A similar picture becomes emerges in terms of delivery reliability. This may exhibit different results in different periods of time. For example, delivery reliability will increase in phases of full load within production, in contrast to periods of time when, for example, a shift change has taken place.
By having an overall large quantity of transport tasks and a considerable time span, local peaks in workloads and the due date violations that come with it will be concealed. Once this pattern has been identified, the shift change can be performed asynchronously and an additional employee can be scheduled for the peak in workload. It also makes sense to filter transport task types, resource types or certain start or destination areas in order to reflect deviations or patterns of behavior.
Indicators for individual processes
Beyond the general KPIs described so far, it is also possible for process-specific KPIs to emerge. A prime example of this is the tugger train. It is a tractor unit that can transport several transport tasks at once. This combination of several transport tasks in a predefined sequence is called a tour. In addition to the KPIs already mentioned, it is also possible to observe whether there are time deviations for the actual starting point or whether the tours take more or less time. Furthermore, deviations from the earlier planning give an indication of whether the system is set up properly or whether there are discrepancies between what was planned and what was done. This was, among other things, evaluated in the MUC Route research project in cooperation with the Technical University of Munich and integrated into a key performance indicator system for the tugger train. This will be covered in more detail in one of the next articles on this topic.
In addition to the resource-specific indicators, there are also other key indicators, which are customer-specific, that depict a process or logistics aspect. A good example for this are key indicators related to production supply, which, for example, contain a special destination storage area via a link to the WM transfer task, and can be classified by this area. This is where you come in: Are there any indicators that you would like to determine but currently are not able to? Please feel free to contact us!
You can look forward to exciting articles in the future with more information on indicators within logistics and the potential they harbor. In the next article, we will focus on the approach taken in the FML research project in particular. We will share with you how we determined and created the KPIs!

Author – Jonathan Hohm
Data Analyst & AI Developer
Working at Flexus, he provides optimizations for the intralogistics of our customers with well-suited optimization algorithms. This primarily takes place in the optimization of forklifts, tugger train logics and the efficient control of AGVs.

